
Previous Story
Technical analysis for EUR/USD for March 6, 2019
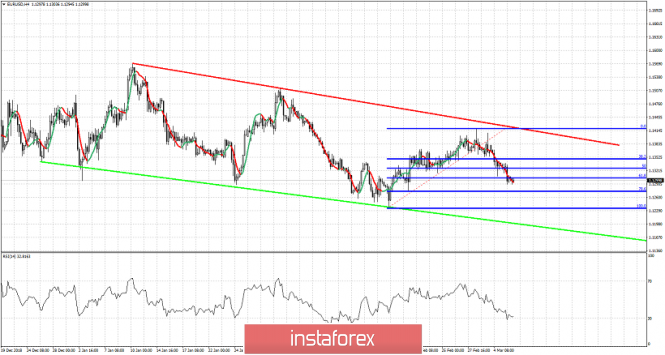
EUR/USD is testing the 1.13 support level which is also the 61.8% Fibonacci retracement of the last leg higher from 1.1235 to 1.1420. Failing to hold this support area will open the way for a move below 1.1235.
Red line – major trend line resistance
Green line – support trend line
EUR/USD has turned lower as expected after getting rejected at our target area of 1.14-1.1430. EUR/USD is making lower lows and lower highs and has recently moved below the 61.8% Fibonacci retracement. The RSI has still not reached oversold levels in the 4-hour chart. This downward move that started at 1.1420 still has room to go. We remain bearish as long as price is below the red trend line resistance as we have repeated many times before in our past analysis. Our downside target is at 1.12. Resistance is found at 1.1360-1.1380 area and next at the red trend line resistance at 1.1415. As long as we trade below these levels I remain bearish.
The material has been provided by InstaForex Company – www.instaforex.com


