
Previous Story
Technical analysis for EUR/USD for November 19, 2018
Posted On 19 Nov 2018
Comment: 0
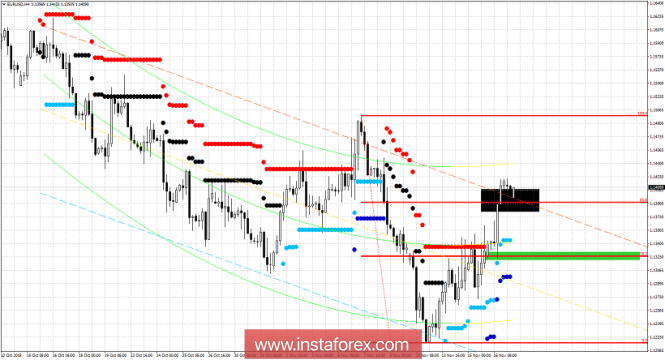
Short-term bullish trend in EUR/USD remains. Price has bounced from 1.1250 as expected towards the upper channel boundary and towards the 61.8% Fibonacci retracement. The 1.15 resistance area could be challenged but I continue to believe that our main focus should remain to the downside.
Black rectangle – resistance area
Green rectangle -short-term support
Blue dots – medium strength support
Dark blue dots – major strength support
EUR/USD has reached the 61.8% Fibonacci level. From current levels I see prices pull back. If the pull back breaks below the green rectangle area then the entire upward bounce is over and the next leg down will have started. If prices hold above the blue dots and the green rectangle area, we could see more upside towards 1.15. Overall I expect selling pressures to come back again and push price below 1.12.
The material has been provided by InstaForex Company – www.instaforex.com
Source:: Technical analysis for EUR/USD for November 19, 2018


