
Previous Story
Technical analysis for Gold for April 19, 2019
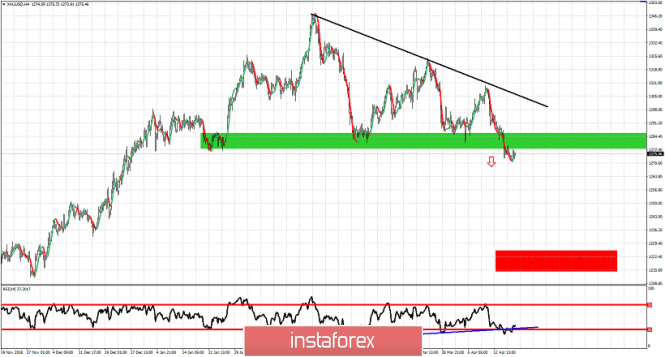
Gold price remains in a bearish short-term trend. Gold price broke below important support levels but the move lower has not extended yet towards our $1,250-60 target area. Price has only reached as low as $1,270.
Green rectangle – major support area now resistance
Red rectangle – target
Black line – major resistance trend line
Gold price as explained in previous posts might first need to make a back test of the broken support now resistance area of $1,280-90. The RSI has broken through the blue trend line support but is also turning upwards. This could mean a bounce towards $1,290 could come over the next few sessions. As long as price is below the black trend line resistance medium-term trend remains bearish and Gold is vulnerable to a move towards $1,250-$1,220.
The material has been provided by InstaForex Company – www.instaforex.com


