
Previous Story
Technical analysis for Gold for February 19, 2019
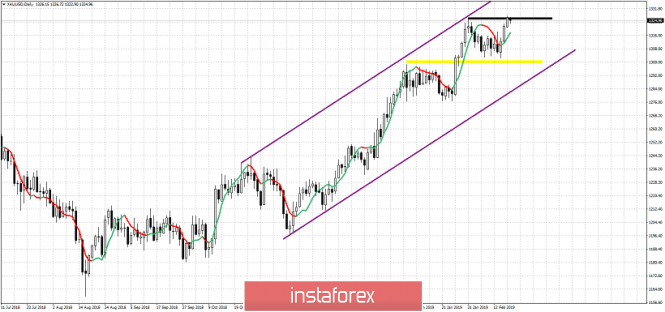
Gold price is making higher highs as expected after breaking above the short-term resistance at $1,317. In our past analysis I mentioned that $1,317 was the key resistance for more upside. Breaking above it would provide a bullish signal.
Purple lines – bullish channel
Yellow rectangle – major support
Black line – resistance
Gold price remains in a bullish trend as price continues to make higher highs and higher lows. Support remains at $1,300 and if broken we could see the end of the up trend since August. Resistance and previous highs were broken yesterday but price remains around this area. As long as price is above $1,311 we continue to expect to see $1,330-40 area.
The material has been provided by InstaForex Company – www.instaforex.com


