
Previous Story
Technical analysis for Gold for February 25, 2019
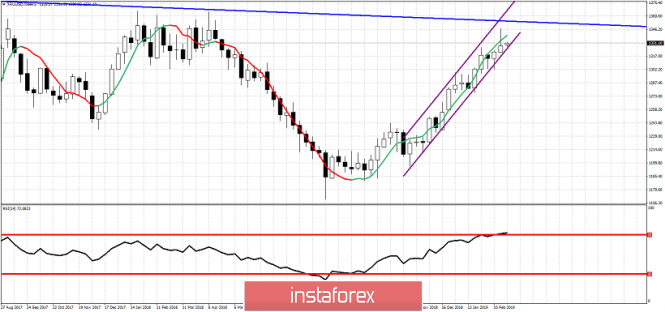
Gold price is trading around $1,330 holding short-term important area of $1,326-30 once resistance now support. Price pulled back for a back test of the break out area and it seems that it was successful as price trades above it.
Purple lines – bullish channel
Blue line -long-term resistance trend line
Gold price remains inside a bullish channel. Medium-term trend remains bullish as long as price is above $1,300. The previous weekly candle had a long upper tail creating a bearish reversal hammer pattern. For this pattern to be confirmed bears will need to see a follow through to last weeks selling pressures. The RSI is at overbought levels and price is also very close to our longer-term target of $1,350. This is the time for longer-term traders to be cautious as a major rejection could take place. Short-term support is at $1,326 and if we see a daily close below it, we should expect a deeper pull back. Holding above $1,326 in the short-term could increase the chances of making a new higher high towards $1,350-60 area.
The material has been provided by InstaForex Company – www.instaforex.com


