
Previous Story
Technical analysis for Gold for January 22, 2019
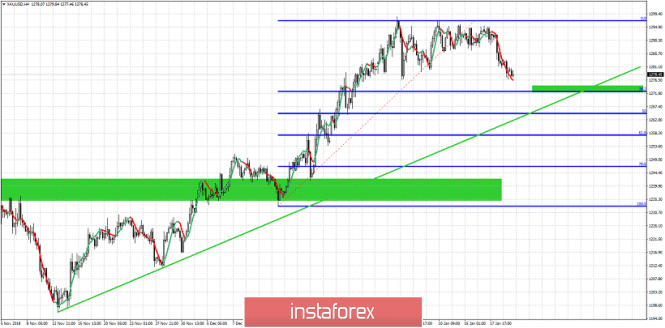
Gold price got rejected at $1,300 and broke the triangle pattern downwards. Our target remains $1,272 area and the 38% Fibonacci retracement level. Bulls will need to react from this support area.
Green rectangles – support areas
Green line – long-term trend line support
Gold price is moving towards the 38% Fibonacci retracement level and the first green support area as expected after the triangle breakdown. Bulls must hold this support level and push prices higher. A break below this area of support at $1,272-75 would be a bearish sign. As long as price is above the green long-term trend line support, the medium-term bullish trend targeting $1,320 is intact. If this trend line fails to hold we could call a major top is in.
The material has been provided by InstaForex Company – www.instaforex.com


