
Previous Story
Technical analysis for Gold for March 4, 2019
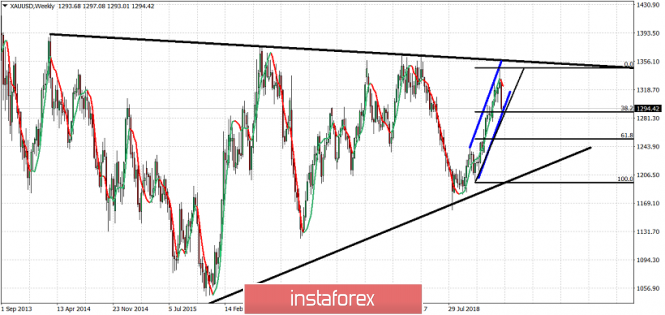
Gold price has made a strong reversal from $1,340 area as expected. Gold price has pulled back right at the lower channel boundary and 38% Fibonacci retracement of the rise from $1,196. For a move towards $1,350-60 to be seen next, Gold bulls must step in now and push prices back above $1,300 and stay above it.
Blue lines – medium-term bullish channel
Black lines – contracting triangle pattern
Gold price remains inside the long-term triangle boundaries, but space starts running out. Price has reached the upper triangle boundary and major resistance area at $1,350-60. In the medium-term Gold price remains inside the bullish channel and has reached the important 38% Fibonacci retracement. A bounce should follow soon if we are going to see over the coming months the $1,350-60 level. A break below the channel and staying below $1,300 would be a bearish sign implying that Gold is heading back towards the lower triangle boundary around $1,200.
The material has been provided by InstaForex Company – www.instaforex.com


