
Previous Story
Technical analysis for Gold for November 19, 2018
Posted On 19 Nov 2018
Comment: 0
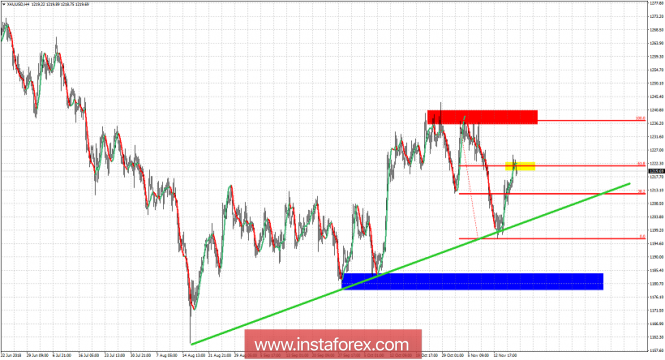
Gold price has reached the 61.8% Fibonacci retracement and the $1,222-23 resistance area as expected, after breaking above the $1,213 short-term resistance. Gold could continue a bit higher but I do not see it breaking above $1,243.50. I expect Gold price to soon reverse to the downside.
Green line – trend line support
Blue rectangle – support area
Yellow rectangle – short-term resistance
Red rectangle – major resistance
Gold price has bounced from the green trend line support and has already reached the 61.8% Fibonacci level. This is important short-term resistance. If prices break below the green trend line we should expect Gold price to fall towards the blue area. If Gold price breaks above the $1,240-43.50 area we should expect Gold price to reach $1,255-60 area. I’m currently bearish expecting a lower high. I see this bounce as a selling opportunity with stops placed at $1,243.50.
The material has been provided by InstaForex Company – www.instaforex.com


