
Previous Story
Technical analysis for the EUR/USD currency pair for the week from September 23 to 28, 2019
Trend analysis.
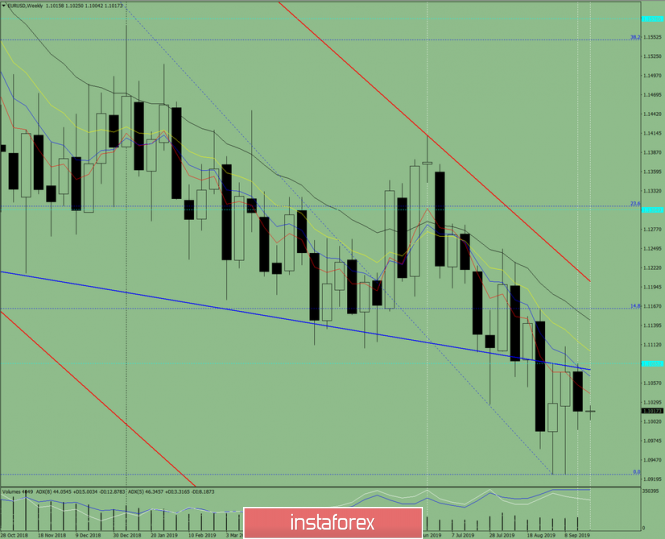
This week, the price will once again try to overcome the resistance line of 1.1076 (blue bold line).
Fig. 1 (weekly chart).
Complex analysis:
– Indicator analysis – up;
– Fibonacci levels – up;
– Volumes – up;
– Candlestick analysis – neutral;
– Trend analysis – down;
– Bollinger bands – down;
– Monthly chart – up.
The conclusion of the complex analysis is an upward movement.
The overall result of calculating the candle of the EUR/USD currency pair according to the weekly chart: the price of the week is likely to have an upward trend with the absence of the first lower shadow of the weekly white candlestick (Monday – up) and the absence of the second upper shadow (Friday – up).
The material has been provided by InstaForex Company – www.instaforex.com
Source:: Technical analysis for the EUR/USD currency pair for the week from September 23 to 28, 2019


