
Previous Story
Technical analysis for the EUR/USD pair for the week of June 1 to 6
Trend analysis.
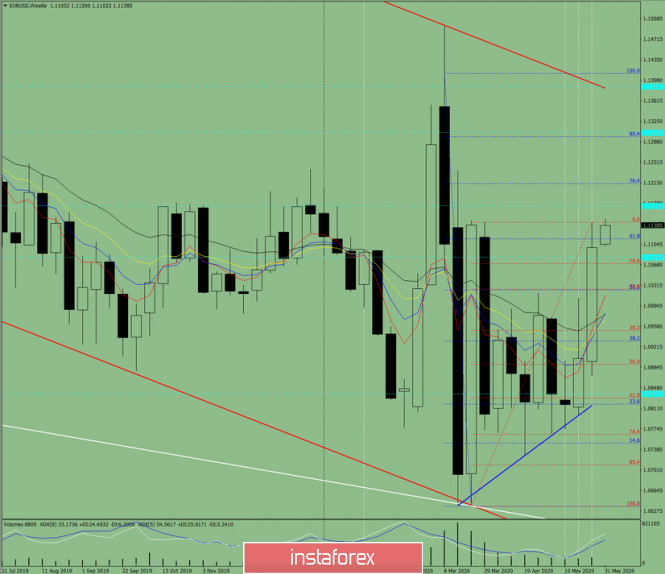
This week, the price from the level of 1.1099 (closing of the last weekly candle) may continue to move up with the first target 1.1174 – the historical resistance level (blue dashed line). After reaching this level, the price will continue to increase to the next upper target 1.1213 – a pullback level of 76.4% (blue dashed line).
Fig. 1 (weekly schedule).
Comprehensive analysis:
– indicator analysis – up;
– Fibonacci levels – up;
– volumes – up;
– candlestick analysis – up;
– trend analysis – up;
– Bollinger Lines – down;
– monthly chart – up.
The conclusion of a comprehensive analysis is an upward movement.
The total result of calculating the candlestick of the EUR/USD currency pair according to the weekly chart: the price of the week is likely to have an upward trend, with the absence of a lower shadow for the weekly white candlestick (Monday – up) and the absence of a second upper shadow (Friday – up).
The upper weekly target 1.1213 is a pullback level of 76.4% (blue dashed line).
An unlikely lower scenario: the price from the upper fractal – 1.1145 (red dashed line) can start moving down, with the first target 1.1024 – a pullback level of 23.6% (red dashed line).
The material has been provided by InstaForex Company – www.instaforex.com
Source:: Technical analysis for the EUR/USD pair for the week of June 1 to 6


