
Previous Story
Technical analysis for the GBP/USD currency pair for the week from November 18-23, 2019
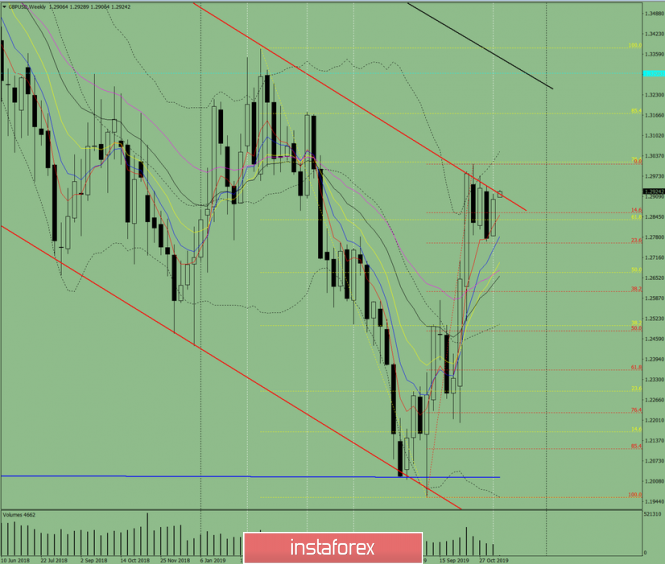
Trend analysis.
This week, the price will move down with the first target of 1.2767 – the lower fractal. If achieved, the next lower target is 1.2643 – 21 average EMA (black thin line).
Fig. 1 (weekly chart).
Comprehensive analysis:
– Indicator analysis – down;
– Fibonacci levels – down;
– Volumes – down;
– Candlestick analysis – down;
– Trend analysis – down;
– Bollinger Bands – down;
– Monthly chart – down.
The conclusion of comprehensive analysis – a downward movement.
The overall result of calculating the candle of the GBP/USD currency pair according to the weekly chart: the price for weeks is more likely to have a downward trend with the presence of the first upper shadow of the weekly black candlestick (Monday – up) and the absence of the second lower shadow (Friday – down).
The first lower target of 1.2767 – the lower fractal. If achieved, the next lower target is 1.2643 – 21 average EMA (black thin line).
An unlikely scenario – from the level of 1.2910, work up with the target of 1.3011 – the upper fractal (red dashed line).
The material has been provided by InstaForex Company – www.instaforex.com
Source:: Technical analysis for the GBP/USD currency pair for the week from November 18 to 23


