
Previous Story
Technical analysis for the GBP/USD currency pair for the week from September 23 to 28, 2019
Trend analysis.
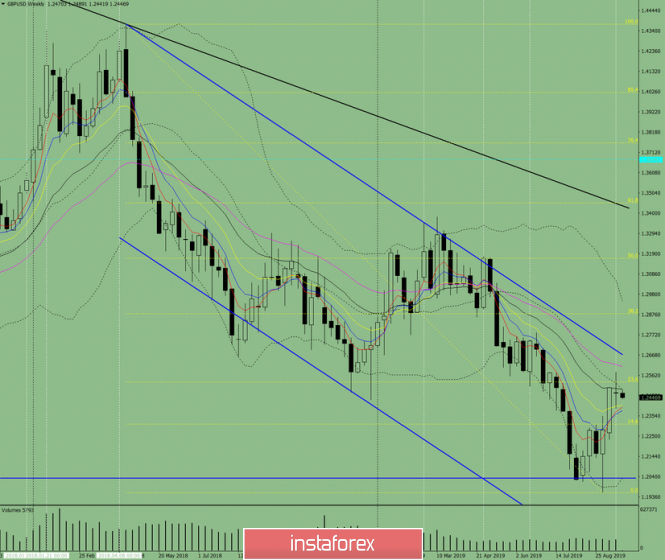
This week, the price will move up with the first target of 1.2668 – resistance line (blue bold line). In the case of achievement – rolling work down.
Fig. 1 (weekly chart).
Complex analysis:
– Indicator analysis – up;
– Fibonacci levels – up;
– Volumes – up;
– Candle analysis – up;
– Trend analysis – up;
– Bollinger bands – up;
– Monthly chart – up.
The conclusion of the complex analysis is an upward movement.
The overall result of calculating the candle of the GBP/USD currency pair according to the weekly chart: the price of the week is likely to have an upward trend with the presence of the first lower shadow of the weekly white candlestick (Monday – down) and the absence of the second upper shadow (Friday – up).
The material has been provided by InstaForex Company – www.instaforex.com
Source:: Technical analysis for the GBP/USD currency pair for the week from September 23 to 28, 2019


