
Previous Story
Technical analysis for US Dollar Index for January 25, 2019
Posted On 25 Jan 2019
Comment: 0
Technical outlook:
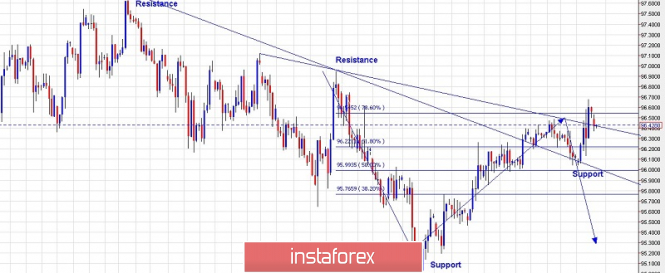
We have presented the 4H chart view for US Dollar Index since December 14, 2019 when 97.71 high was print. As depicted here, the immediate price resistance is seen at 97.00, followed by 97.71 levels, while support is seen at 96.00, followed by 95.00 levels respectively. Please note that the recent swing that is being worked upon is between 97.00 and 95.00 levels respectively and prices have reacted at the fibonacci 0.786 level of the same. Furthermore, an intermediary resistance trend line has also been tested yesterday. A continued bearish reaction here and subsequent break below 96.00 levels would trigger further selloff and prices should proceed towards 94.00 levels at least. Please note that bearish outlook prevails until prices remain below 97.71 levels going forward.
Trading plan:
Remain short, stop at 97.71, target @ 94.00
Good luck!
The material has been provided by InstaForex Company – www.instaforex.com
Source:: Technical analysis for US Dollar Index for January 25, 2019


