Previous Story
Technical analysis GBP/USD for 25/01/2019
Market technical overview:
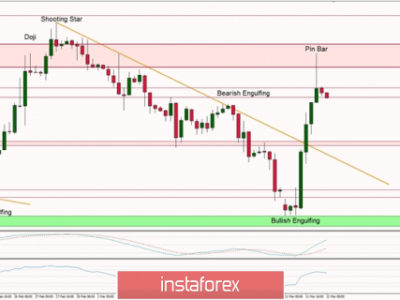
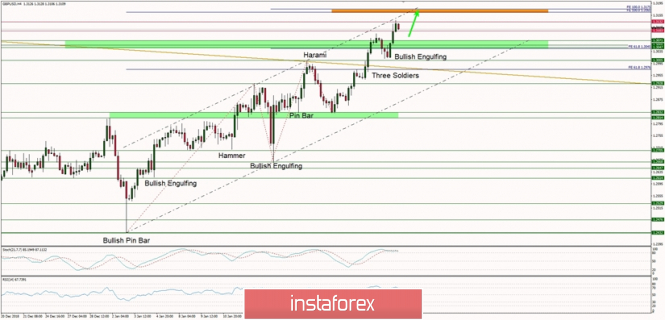
The GBP/USD pair has broken above the technical resistance zone located at 1.3047 – 1.3071 zone and is on its way towards the projected Fibonacci target at 1.3165 – 1.3175 zone (orange rectangle). Currently, the pair is experiencing a slight pull-back after hitting the local resistance at the level of 1.3132, but it should reverse soon and continue the rally.
The market conditions are now overbought, but the momentum is still strong and positive albeit it shows the first indication of a bearish divergence between the momentum and price. In a case of a deeper pull-back, the key technical support is seen between the levels of 1.3047 – 1.3071
Recommendations:
The bearish bullish is still continuing, so the all of the buy orders should be still kept open with a projected target at the level of 1.3165 – 1.3175 zone. Please beware of the local pull-backs on the way up due to the building bearish divergence.
The material has been provided by InstaForex Company – www.instaforex.com