
Previous Story
Technical analysis of GBP/JPY for August 02, 2017
Posted On 02 Aug 2017
Comment: 0
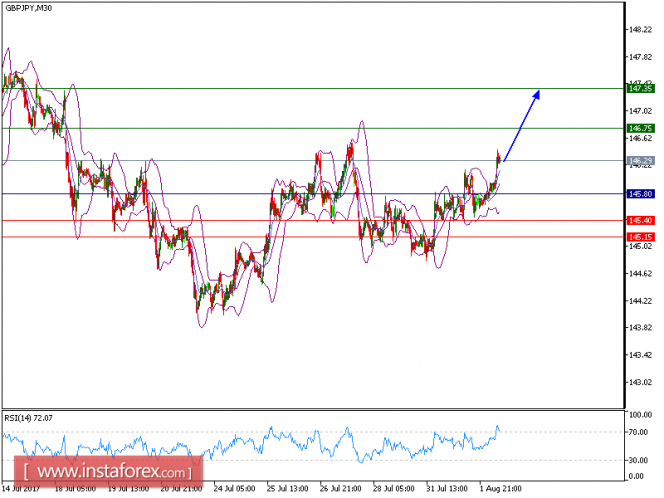
GBP/JPY is expected to trade in higher range. The outlook for this pair is positive above a rising trend line, which emerged on July 28. The rising 20-period and 50-period moving averages are playing support roles and maintain the upside bias. The relative strength index stands firmly above its neutrality level at 50 and lacks downward momentum.
As long as 145.80 holds on the downside, look for a further advance towards 146.75 and even 147.35 in extension.
Alternatively, if the price moves in the opposite direction as predicted, a long position is recommended above 145.65 with the target at 145.60.
Strategy: BUY, Stop Loss: 145.80, Take Profit: 146.75.
Chart Explanation: the black line shows the pivot point. The price above the pivot point indicates the bullish position and when it is below the pivot points, it indicates a short position. The red lines show the support levels and the green line indicates the resistance levels. These levels can be used to enter and exit trades.
Resistance levels: 146.75, 147.35, and 148.00
Support levels: 145.40, 145.15, and 144.75.
The material has been provided by InstaForex Company – www.instaforex.com


