
Previous Story
Technical analysis of GBP/JPY for August 09, 2017
Posted On 09 Aug 2017
Comment: 0
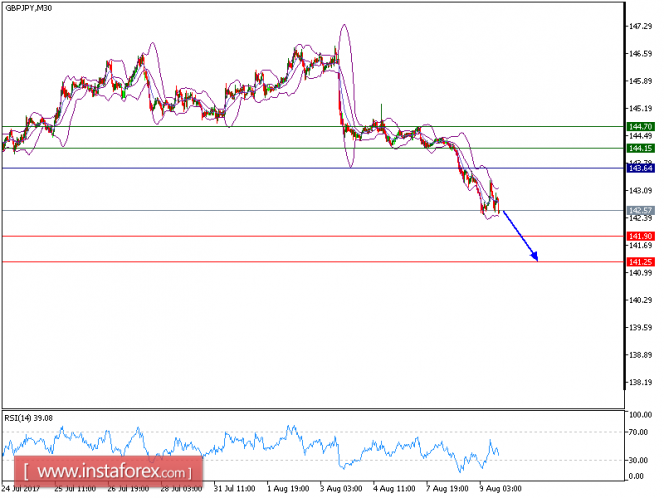
All our targets which we predicted in yesterday’s analysis has been hit. GBPJPY is under pressure and expected to continue its downside movement. The pair broke below its former key support at 143.65, which becomes a key resistance now, and consolidated on the downside. The relative strength index is bearish below its 30% level and lacks upward momentum. The descending 20-period and 50-period moving averages are playing resistance roles and maintain the downside bias.
As long as 143.65 holds on the upside, look for a further drop towards 141.90 and even 141.25 in extension.
Alternatively, if the price moves in the opposite direction as predicted, a long position is recommended above 143.65 with the target at 144.15.
Strategy: SELL, Stop Loss: 143.65, Take Profit: 143.35.
Chart Explanation: the black line shows the pivot point. The price above the pivot point indicates the bullish position and when it is below the pivot points, it indicates a short position. The red lines show the support levels and the green line indicates the resistance levels. These levels can be used to enter and exit trades.
Resistance levels: 144.15, 144.70, and 145.25
Support levels: 141.90, 141.25, and 140.65.
The material has been provided by InstaForex Company – www.instaforex.com


