
Previous Story
Technical analysis of GBP/JPY for August 16, 2017
Posted On 16 Aug 2017
Comment: 0
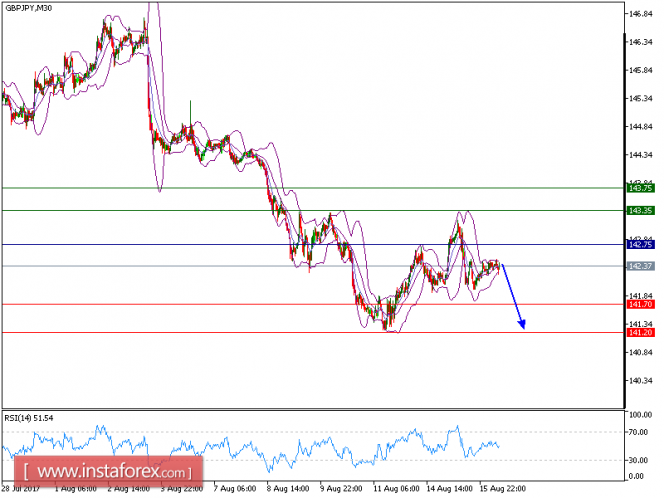
The targets which we predicted in the previous analysis have been achieved. GBP/JPY is under pressure and expected to trade in a lower range. The pair recorded lower tops and lower bottoms, which confirmed a negative outlook. The declining 50-period moving average suggests that the prices have a potential for a further decline. The relative strength index is mixed with a bearish bias.
To conclude, as long as 142.75 holds on the upside, expect a new drop to 141.70 and even to 141.20 in extension.
Alternatively, if the price moves in the opposite direction as predicted, a long position is recommended above 142.75 with the target at 143.35.
Strategy: BUY, Stop Loss: 141.70, Take Profit: 142.80.
Chart Explanation: the black line shows the pivot point. The price above the pivot point indicates the bullish position; and when it is below the pivot points, it indicates a short position. The red lines show the support levels and the green line indicates the resistance levels. These levels can be used to enter and exit trades.
Resistance levels: 143.35, 143.75, and 144.35
Support levels: 141.20, 140.50, and 140.00
The material has been provided by InstaForex Company – www.instaforex.com


