
Previous Story
Technical analysis of GBP/JPY for August 29, 2017
Posted On 29 Aug 2017
Comment: 0
GBP/JPY is expected to trade with a bullish outlook. The pair stands firmly above its key support at 0.9230 and is likely to post a new rebound. The 20-period and 50-period moving averages are heading upward, which should confirm a positive outlook. Last but not least, the relative strength index is mixed to bullish. Even though a consolidation cannot be ruled out, its extent should be limited.
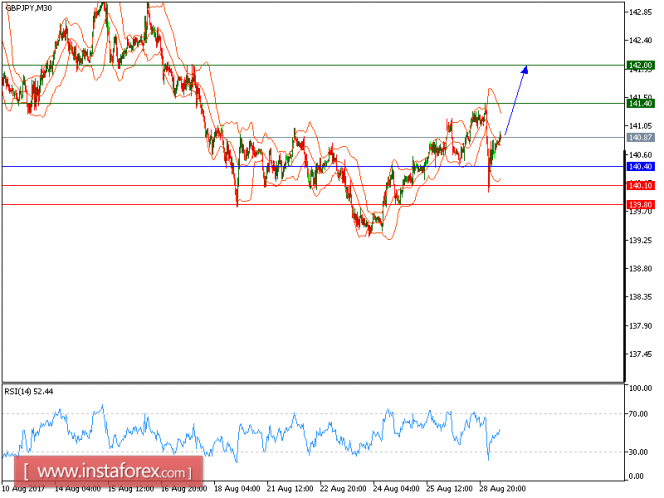
As long as 140.40 is not broken, look for further advance to 141.40 and 142 in extension.
Alternatively, if the price moves in the opposite direction as predicted, a short position is recommended below 140.40 with the target at 140.10.
Strategy: BUY, Stop Loss: 140.40, Take Profit: 141.40.
Chart Explanation: the black line shows the pivot point. The price above the pivot point indicates the bullish position; and when it is below the pivot points, it indicates a short position. The red lines show the support levels and the green line indicates the resistance levels. These levels can be used to enter and exit trades.
Resistance levels: 141.40, 142.00, and 142.50
Support levels: 140.10, 139.80, and 139.10
The material has been provided by InstaForex Company – www.instaforex.com


