
Previous Story
Technical analysis of GBP/JPY for July 31, 2017
Posted On 31 Jul 2017
Comment: 0
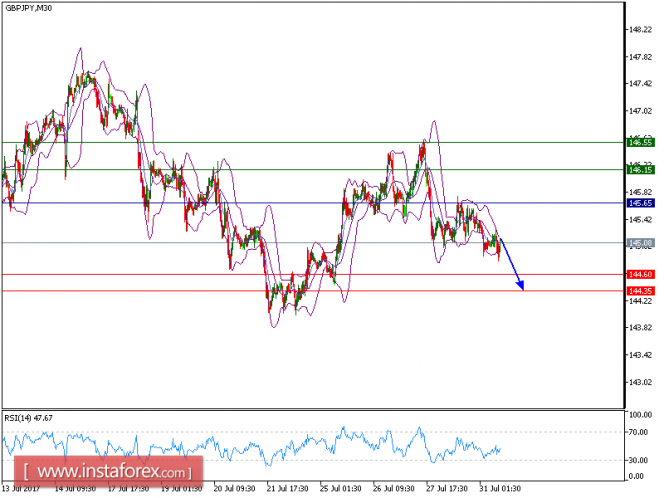
GBP/JPY is expected to trade in lower range as far as key resistance lies at 145.65. The pair broke below its 50-period moving average and is consolidating on the downside. The 20-period moving average is heading downwards and is likely to cross below the 50-period one. The relative strength index is below its neutrality level at 50 and lacks upward momentum.
As long as 145.65 holds on the upside, look for a further drop towards 144.60 and even 144.35 in extension.
Alternatively, if the price moves in the opposite direction as predicted, a long position is recommended above 145.65 with the target at 145.60.
Strategy: SELL, Stop Loss: 145.65, Take Profit: 1444.60.
Chart Explanation: the black line shows the pivot point. The price above pivot point indicates the bullish position and when it is below pivot points, it indicates a short position. The red lines show the support levels and the green line indicates the resistance levels. These levels can be used to enter and exit trades.
Resistance levels: 146.60, 146.55, and 147.45
Support levels: 144.60, 144.35, and 143.75.
The material has been provided by InstaForex Company – www.instaforex.com


