
Previous Story
Technical analysis of GBP/JPY for July 4, 2017
Posted On 04 Jul 2017
Comment: 0
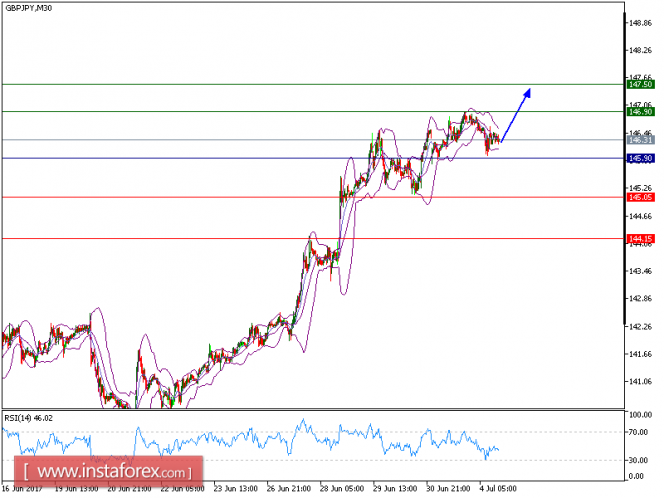
We will retain our yesterday’s prediction that the pair is expected to move upward. The pair is currently testing the support of its 50-period moving average, and remains above the horizontal support at 145.90. The 20-period moving average is still holding above the 50-period moving average, and the relative strength index is around its neutrality area at 50, lacking downward momentum.
As long as 145.90 is not broken down, a further advance is preferred with 146.90 and 147.50 as targets.
Alternatively, if the price moves in the opposite direction as predicted, a short position is recommended below 145.90 with the target at 145.05.
Chart Explanation: the black line shows the pivot point. The price above pivot point indicates the bullish position and when it is below pivot points, it indicates a short position. The red lines show the support levels and the green line indicates the resistance levels. These levels can be used to enter and exit trades.
Strategy: BUY, Stop Loss: 145.90, Take Profit: 146.50.
Resistance levels: 146.90, 147.50, and 148.00
Support levels: 145.05, 144.15, and 143.15
The material has been provided by InstaForex Company – www.instaforex.com


