
Previous Story
Technical analysis of GBP/JPY for June 26, 2017
Posted On 26 Jun 2017
Comment: 0
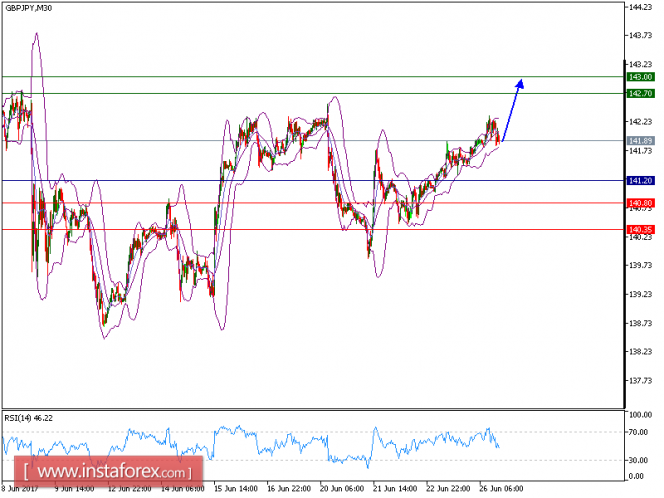
As predicted on Fridayб GBP/JPY is trading higher. The pair is trading above the rising 50-period moving average, which plays a support role and maintains the upside bias. The relative strength index is mixed with a bullish bias. Even though a continuation of the consolidation cannot be ruled out, its extent should be limited.
Hence, above 141.20, look for a further upside 142.70 and 143 in extension.
Alternatively, if the price moves in the opposite direction as predicted, a short position is recommended below 140.80 with the target at 140.35.
Chart Explanation: the black line shows the pivot point. The price above pivot point indicates the bullish position and when it is below pivot points, it indicates a short position. The red lines show the support levels and the green line indicates the resistance levels. These levels can be used to enter and exit trades.
Strategy: BUY, Stop Loss: 141.20, Take Profit: 142.70.
Resistance levels: 142.70, 143.00, and 143.45
Support levels: 140.80, 140.35, and 141.15
The material has been provided by InstaForex Company – www.instaforex.com


