
Previous Story
Technical analysis of GBP/JPY for November 30, 2017
Posted On 30 Nov 2017
Comment: 0
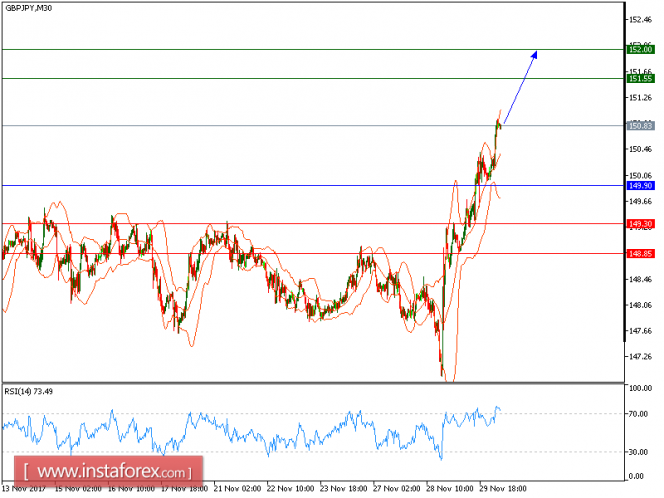
All our upside targets which we predicted in yesterday’s analysis have been hit. the pair is expected to continue its upside movement. The pair managed to break above its horizontal level at 149.90, which should confirm a bullish reversal. The 50-period moving average is turning up and should continue to push the prices higher. Besides, the relative strength index shows upside momentum.
To conclude, as long as 149.90 is not broken, look for further advance to 151.55 and 152 in extension.
Alternatively, if the price moves in the direction opposite to the forecast, a short position is recommended below 149.90 with the target at 149.30.
Strategy: BUY, Stop Loss: 149.90, Take Profit: 151.55
Chart Explanation: the black line shows the pivot point. The price above the pivot point indicates long positions; and when it is below the pivot points, it indicates short positions. The red lines show the support levels and the green line indicates the resistance levels. These levels can be used to enter and exit trades.
Resistance levels: 151.55, 152.00, and 152.60
Support levels: 149.30, 148.85, and 148
The material has been provided by InstaForex Company – www.instaforex.com
Source:: Technical analysis of GBP/JPY for November 30, 2017


