
Previous Story
Technical analysis of GBP/JPY for September 12, 2017
Posted On 12 Sep 2017
Comment: 0
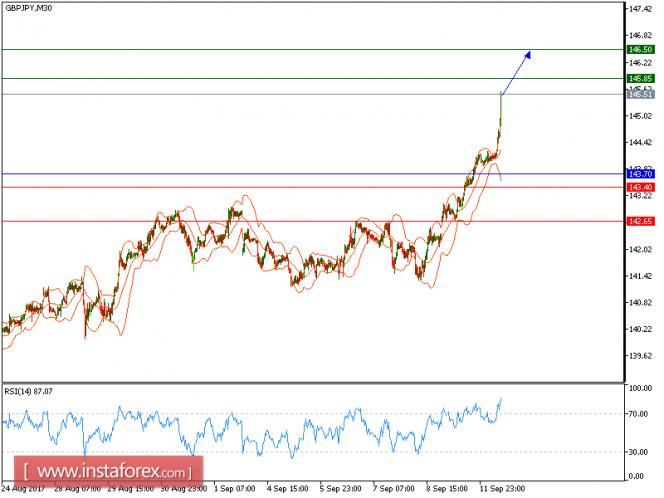
GBP/JPY is expected to continue its upside movement in today’s trading. The pair recorded higher tops and higher bottoms, which confirmed a positive outlook. The upward momentum is further reinforced by both rising 20-period and 50-period moving averages. The relative strength index advocates another upside.
Therefore, as long as 143.70 holds on the downside, a new advance to 145.85 and even to 146.50 seems more likely to occur.
Alternatively, if the price moves in the direction opposite to the forecast, a short position is recommended below 143.70 with the target at 143.40.
Strategy: BUY, Stop Loss: 143.70, Take Profit: 145.85.
Chart Explanation: the black line shows the pivot point. The price above the pivot point indicates the bullish position; and when it is below the pivot points, it indicates a short position. The red lines show the support levels and the green line indicates the resistance levels. These levels can be used to enter and exit trades.
Resistance levels: 145.85, 146.50, and 147.15
Support levels: 143.40, 142.65, and 142.00
The material has been provided by InstaForex Company – www.instaforex.com
Source:: Technical analysis of GBP/JPY for September 12, 2017


