
Previous Story
Technical analysis of GBP/JPY for September 15, 2017
Posted On 15 Sep 2017
Comment: 0
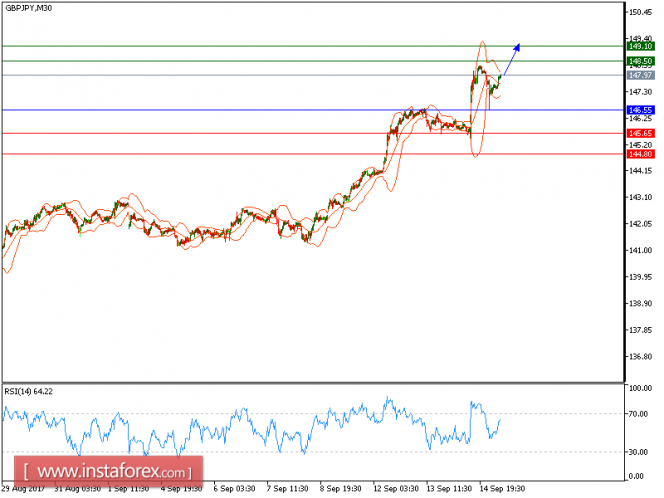
We will retain our yesterday’s outlook of GBP/JPY. It is still expected to trade in a higher range. The pair is holding on the upside and is trading above its rising 20-period and 50-period moving averages, which play support roles. The relative strength index is above its neutrality level at 50.
To conclude, as long as 146.55 holds on the downside, look for a further rise to 48.50 and even to 149.10 in extension.
Alternatively, if the price moves in the direction opposite to the forecast, a short position is recommended below 146.55 with the target at 145.65.
Strategy: BUY, Stop Loss: 146.55, Take Profit: 148.50.
Chart Explanation: the black line shows the pivot point. The price above the pivot point indicates the bullish position; and when it is below the pivot points, it indicates a short position. The red lines show the support levels and the green line indicates the resistance levels. These levels can be used to enter and exit trades.
Resistance levels: 148.50, 149.10, and 149.60
Support levels: 145.65, 144.80, and 144.00
The material has been provided by InstaForex Company – www.instaforex.com
Source:: Technical analysis of GBP/JPY for September 15, 2017


