
Previous Story
Technical analysis of GBP/JPY for September 19, 2017
Posted On 19 Sep 2017
Comment: 0
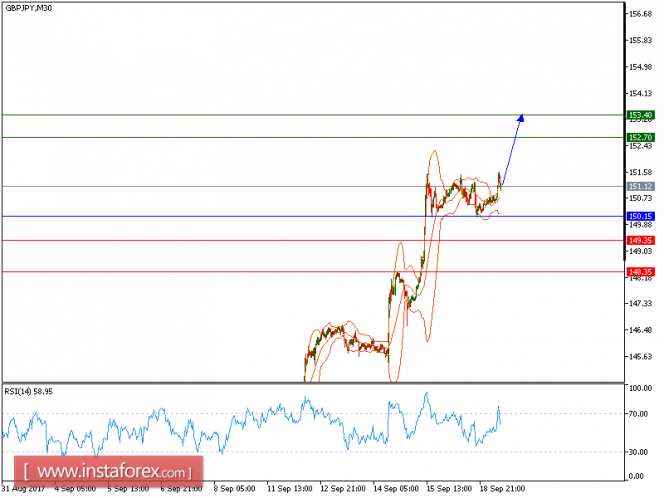
Our first upside target which we predicted in yesterday’s analysis at 151.60 has been hit. The short-term trend remains up following the rebound from the key support level at 150.15 former key resistance. On an intraday basis, the pair is supported by its ascending 20-period and 50-period moving averages.
We suggest long positions above 150.15 with targets at 152.70 and 153.40 in extension.
Alternatively, if the price moves in the direction opposite to the forecast, a short position is recommended below 150.15 with the target at 149.35.
Strategy: BUY, Stop Loss: 150.15, Take Profit: 152.70
Chart Explanation: the black line shows the pivot point. The price above the pivot point indicates long positions; and when it is below the pivot points, it indicates short positions. The red lines show the support levels and the green line indicates the resistance levels. These levels can be used to enter and exit trades.
Resistance levels: 152.70, 153.40, and 154.00
Support levels: 149.35, 148.35, and 147.50
The material has been provided by InstaForex Company – www.instaforex.com
Source:: Technical analysis of GBP/JPY for September 19, 2017


