
Previous Story
Technical analysis of GBP/USD for August 14, 2017
Posted On 14 Aug 2017
Comment: 0
Overview:
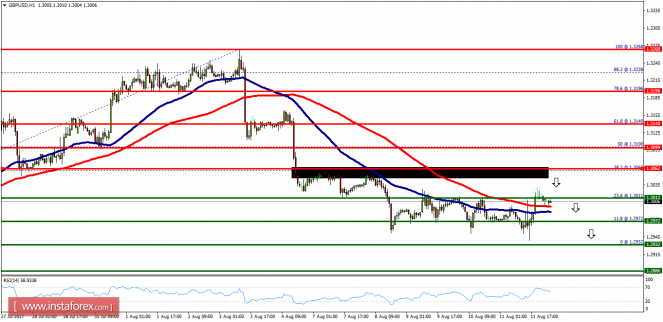
- The GBP/USD pair bullish trend has been formed from the support levels of 1.3012 and 1.3020. Currently, the price is in a bullish channel.
- This is confirmed by the RSI indicator signaling that we are still in a bullish trending market. As the price is still above the moving average (100), the immediate support is seen at 1.3011, which coincides with a ratio of 23.6% Fibonacci.
- Consequently, the first support is set at the level of 1.3011. So, the market is likely to show signs of a bullish trend around the spot of 1.3011/1.3020. Therefore, buy orders are recommended at the price of 1.3020 with the first target at the level of 1.3100.
- Furthermore, if the trend breaks through the first resistance level of 1.3100, then we will see the pair climbing towards the double top (1.3140) to test it.
- On the other hand, it would also be wise to consider where to place a stop loss; this should be set below the second support of 1.2972.
The material has been provided by InstaForex Company – www.instaforex.com


