
Previous Story
Technical analysis of GBP/USD for June 26, 2017
Posted On 26 Jun 2017
Comment: 0
Overview:
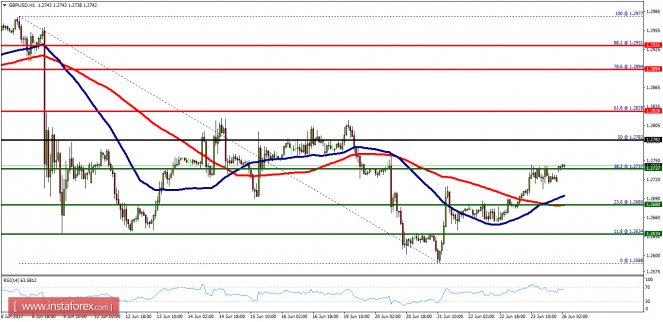
- On the one-hour chart, the GBP/USD pair bullish trend from the support levels of 1.2680 and 1.2737. Currently, the price is in a bullish channel. This is confirmed by the RSI indicator signaling that we are still in a bullish trending market. As the price is still above the moving average (100), immediate support is seen at 1.2737, which coincides with a ratio 38.2% of Fibonacci. Consequently, the first support is set at the level of 1.2737. So, the market is likely to show signs of a bullish trend around the spot of 1.2737. In other words, buy orders are recommended above the level of 1.2737 with the first target at the level of 1.2782 (pivot). Furthermore, if the trend is able to breakout through the first resistance level of 1.2782. We should see the pair climbing towards the second resistance (1.2880) to test it. It would also be wise to consider where to place a stop loss; this should be set below the second support of 1.2680.
The material has been provided by InstaForex Company – www.instaforex.com


