
Previous Story
Technical analysis of GBP/USD for March 13, 2017
Posted On 13 Mar 2017
Comment: 0
Overview:
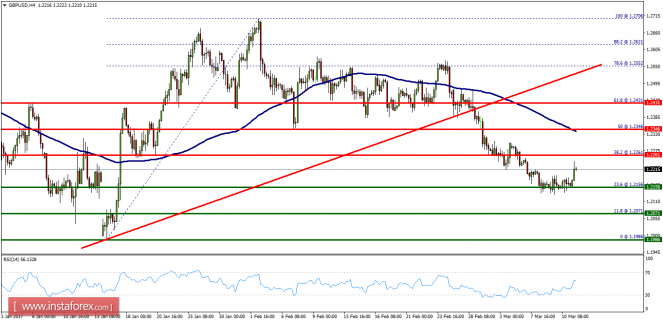
- The market opened below the weekly pivot point (1.2261). It continued moving downwards from the level of 1.2261 to the bottom around 1.2156. Today, the first resistance level is seen at 1.2261 followed by 1.2346, while daily support 1 is seen at 1.2156. The GBP/USD pair broke support, which turned into strong resistance at 1.2261. The pair is trading below this level. It is likely to trade in a lower range as long as it remains below the resistance that is expected to act as major resistance today. This would suggest a bearish market because the RSI indicator is still in a negative area and is not showing any signs of a trend reversal at the moment. Amid the previous events, the GBP/USD pair is still moving between the levels of 1.2261 and 1.2156, so we expect a range of 105 pips in coming hours. Therefore, the major resistance can be found at 1.2261 providing a clear signal to sell with a target seen at 1.2156. If the trend breaks the minor support at 1.2156, the pair will move downwards continuing the bearish trend development to the level of 1.2071 in order to test the daily support 2. Overall, we still prefer the bearish scenario, which suggests that the pair will stay below the zone of 1.2261 today.
The material has been provided by InstaForex Company – www.instaforex.com


