
Previous Story
Technical analysis of GBP/USD for September 11, 2017
Posted On 11 Sep 2017
Comment: 0
Overview:
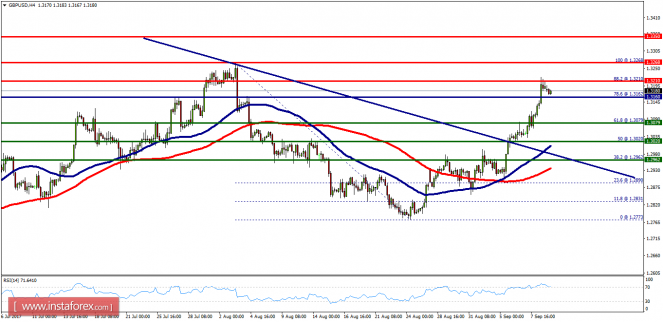
- The GBP/USD pair set above strong support at the level of 1.3079, which coincides with the 61.8% Fibonacci retracement level. This support has been rejected for four times confirming uptrend veracity. Hence, major support is seen at the level of 1.3079 because the trend is still showing strength above it.
Accordingly, the pair is still in the uptrend from the area between 1.3079 and 1.3350. The GBP/USD pair is trading in a bullish trend from the last support line of 1.3079 towards the first resistance level at 1.3210 in order to test it.
This is confirmed by the RSI indicator signaling that we are still in the bullish trending market. Now, the pair is likely to begin an ascending movement to the point of 1.3210 and further to the level of 1.3268.
The level of 1.3268 will act as second resistance and the double top is already set at the point of 1.3350. At the same time, if a breakout happens at the support level of 1.3079, then this scenario may be invalidated. But in overall, we still prefer the bullish scenario.
The material has been provided by InstaForex Company – www.instaforex.com
Source:: Technical analysis of GBP/USD for September 11, 2017


