
Previous Story
Technical analysis of gold for August 7, 2017
Posted On 07 Aug 2017
Comment: 0
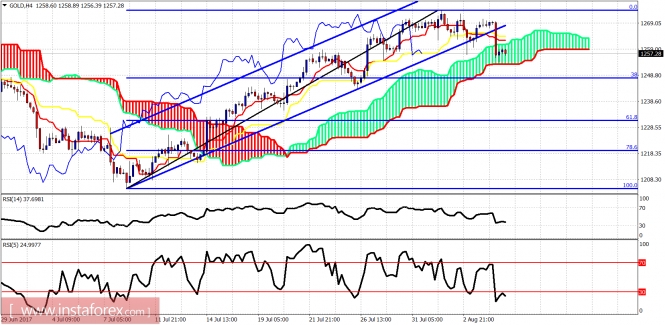
The Gold price has broken the bullish channel downwards and has started a corrective phase. Price is expected to pull back at least towards $1,248. Short-term trend is bearish. I expect the corrective phase to last at least this week.
Blue lines – bullish channel
The Gold price is trading inside the 4 hour Kumo. The trend has changed from bullish to neutral in cloud terms, but technically it is bearish for the short-term as we are now making lower lows and lower highs, having broken the bullish channel. Support is at $1,248 at the 38% Fibonacci retracement.
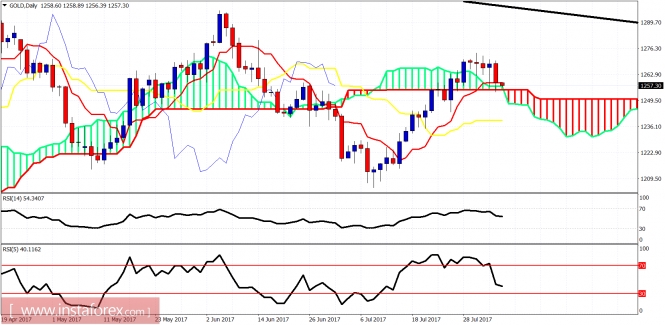
On a daily basis, the price has broken out and above the Daily Kumo (cloud) and is now back testing it. I can see the kijun-sen (yellow line indicator) being tested. The price could reach $1,240 before the next upward move. Key resistance is at $1,270. I remain long-term bullish.The material has been provided by InstaForex Company – www.instaforex.com


