
Previous Story
Technical analysis of gold for February 9, 2017
Posted On 09 Feb 2017
Comment: 0
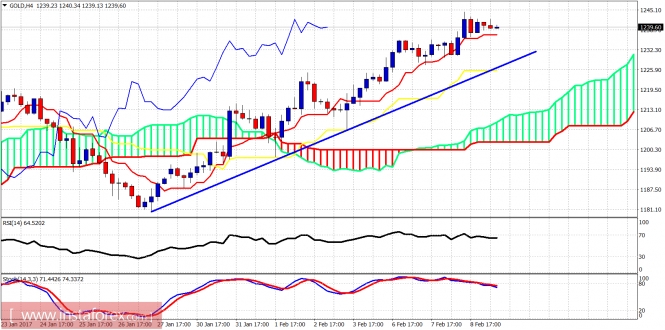
Gold price made a new higher high yesterday at $1,244.50 and is now trading around $1,240. Trend remains bullish. The price is approaching our short-term target of $1,250 where we could see some kind of a deeper pullback maybe towards $1,230.
Blue line – trendline support
Gold price is holding above the tenkan-sen (red line indicator) and is making higher highs and higher lows. Once this change is observed we should expect a pullback towards $1,230 and why not even $1,220-15. Oscillators are diverging. The short-term trend is in danger of turning bearish.
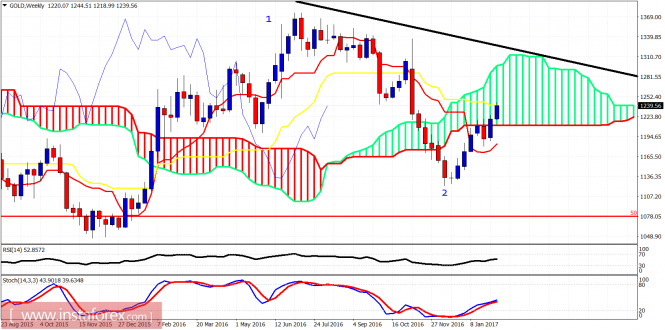
Long-term trend remains bullish as the price has made an important trend reversal at $1,122 and started its next upward move that is expected to be similar if not bigger to the previous leg up from $1,045 to $1,375. The price is testing weekly kijun-sen (yellow line indicator) and this confirms my longer-term bullish view that eventually we are going towards the upper cloud boundary. Oscillators have a lot of room to the upside on a weekly basis.
The material has been provided by InstaForex Company – www.instaforex.com


