
Previous Story
Technical analysis of gold for January 11, 2018
Posted On 11 Jan 2018
Comment: 0
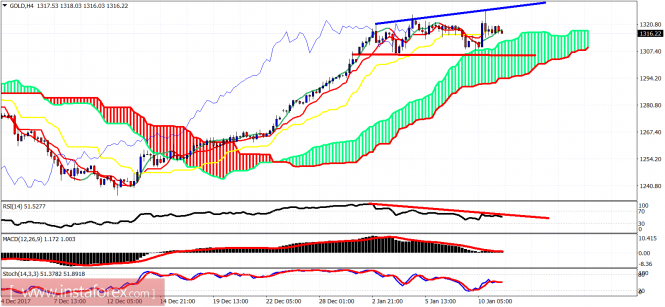
Gold price made a new high yesterday near $1,328 but the oscillators did not confirm it and price fell back down towards $1,315. Price is trading in a sideways manner right now in a tight range.
Blue line – diverging highs
Red line – support
Gold price is trading above the Ichimoku clouds. Trend remains bullish but I ‘m very sure we are in a topping process and prices will come down sharply towards $1,285. Short-term support that must be broken for this scenario to come true is at $1,309. Resistance is at $1,325-28. Breaking above it should push price towards $1,334.
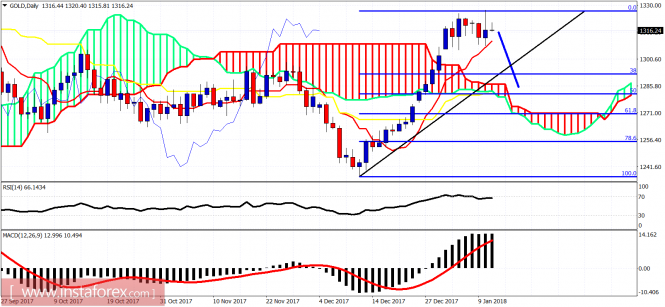
On a daily basis I expect price to move lower towards at least the 38% Fibonacci retracement and the cloud support between $1,270 and $1,285. Yesterday;s daily candle tells me that there are more sellers than buyers at $1,320 and higher in Gold and we should see some weakness affecting price lower today or the latest next week.
The material has been provided by InstaForex Company – www.instaforex.com


