
Previous Story
Technical analysis of gold for January 15, 2018
Posted On 15 Jan 2018
Comment: 0
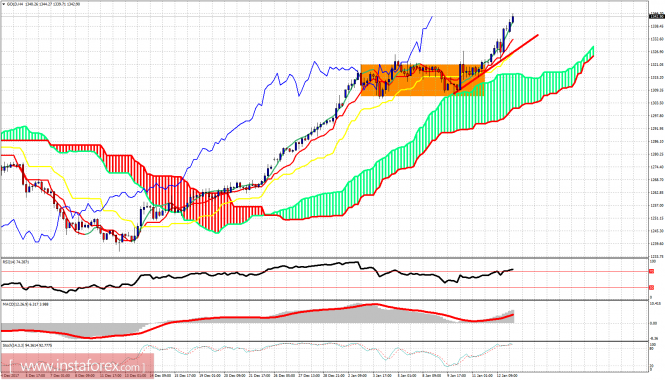
The Gold price is making new highs. The trend is clearly bullish. Gold has broken out of a consolidation range of $1.326-$1.305 and is testing the long-term resistance at $1,350.
Orange rectangle – consolidation range
Red line – short-term trend line support
The consolidation range is now important support for the Gold price. As long as the price is above $1,300 trend will remain bullish. There are divergence signs but these are only warnings. Gold has shown no reversal sign yet. The rise from the $1,237 low looks impulsive. This implies that even a pullback pushes the price below $1,300, Gold will most likely make a higher low and not break below the $1,237 low.
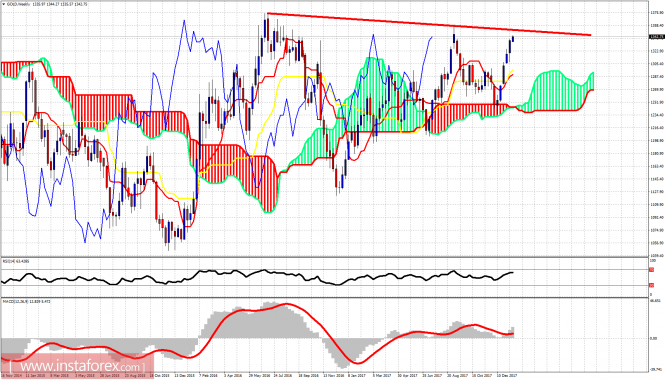
Red line – long-term resistance
The Gold price bounced off the weekly Ichimoku cloud and is now about to test the long-term resistance trend line at $1,350. The rise in price so far has been very steep and if a pull back is seen, it should also be steep. Weekly support is at $1,290 and next at $1,240. So far no sign of rejection or reversal.
The material has been provided by InstaForex Company – www.instaforex.com


