
Previous Story
Technical analysis of gold for January 5, 2018
Posted On 05 Jan 2018
Comment: 0
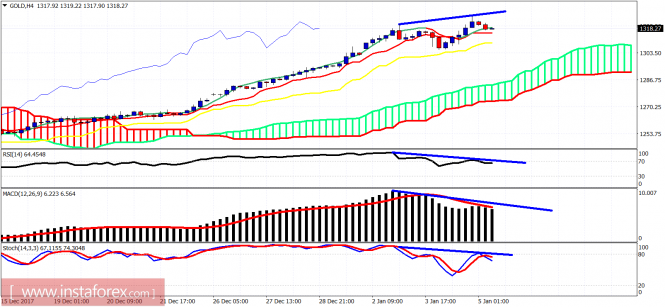
The gold price is showing reversal signs. Key support is at $1,306, while resistance at $1,330-50 is very important and will only be broken after a big pullback.
Blue lines – bearish divergence
The gold price is showing reversal signs. The trend remains bullish on the 4-hour chart, but I expect it to reverse to bearish soon. Support is at $1,306. If it is broken, I expect at least a push towards $1,285. The RSI, Stochastic and the MACD oscillators are diverging and are turning lower.
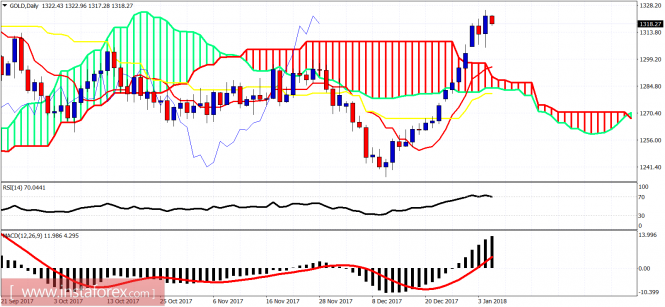
On a daily basis, the gold price is very close or has completed the rise from $1,237. I now expect a pullback. I was expecting the pullback from lower levels, but now the chances of it with the RSI at overbought levels are very high. In the Ichimoku cloud terms, I expect a pullback at least towards cloud support.
The material has been provided by InstaForex Company – www.instaforex.com


