
Previous Story
Technical analysis of gold for July 11, 2017
Posted On 11 Jul 2017
Comment: 0
Gold price continues to trade above $1,200 but remains in a bearish trend. There is a wedge pattern being formed. A daily close above $1,217 will open the way for a big bounce at least towards $1,250.
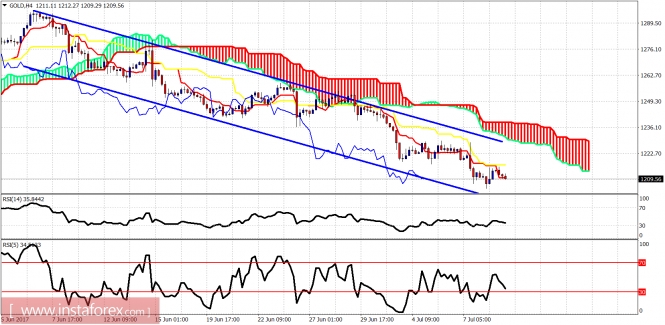
Blue lines – bearish channel
Gold price remains below both the tenkan- and kijun-sen indicators. There are bullish divergence signs in the 4-hour chart. However, the trend remains bearish as long as the price is below $1,235. Support is at $1,205.
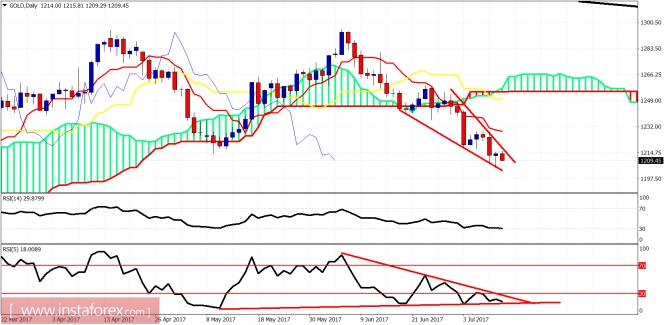
Red lines – wedge pattern
Both daily price candles and the RSI (5) are forming bullish wedge patterns. Traders need to be very cautious as I believe once the wedge patterns break we are going to see a big upward move at least towards $1,250. I remain longer-term bullish.
The material has been provided by InstaForex Company – www.instaforex.com


