
Previous Story
Technical analysis of gold for March 1, 2017
Posted On 01 Mar 2017
Comment: 0
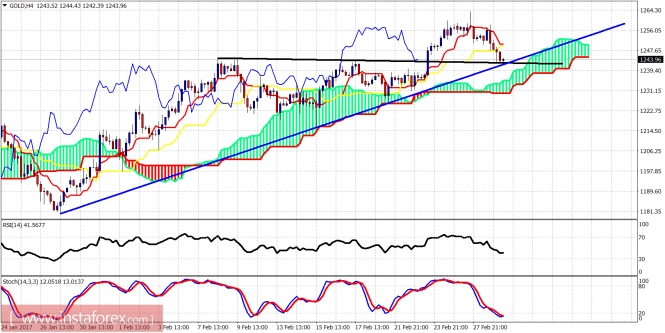
Gold pulled back yesterday, as we explained in our last post, towards the breakout area of $1,245 for a back test. This is a justified move and does not change our medium-term bullish plans. Our targets remain $1,280-$1,320. For the bullish scenario to play out, Gold needs to reverse from current levels.
Black line – resistance (broken)
Blue line – support
The price is trading above the Ichimoku cloud and above the blue trend line support. The price has reached the break out area of $1,245 and I expect to see an upward reversal from the current levels. Support below $1,245 is found at $1,231. Resistance is at $1,250 and the next is at $1,257.
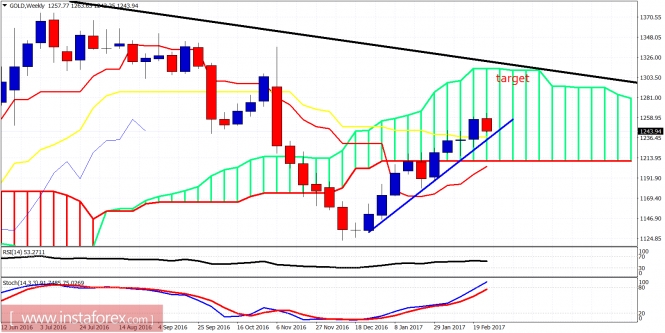
Blue line – long-term support trend line
Black line – long-term resistance trend line
Despite the negative start in the week for Gold, I expect the week to end higher as I believe we may already have seen the weekly lows. I continue to expect Gold to reach $1,280-$1,320. I remain bullish.
The material has been provided by InstaForex Company – www.instaforex.com


