
Previous Story
Technical analysis of gold for March 14, 2017
Posted On 14 Mar 2017
Comment: 0
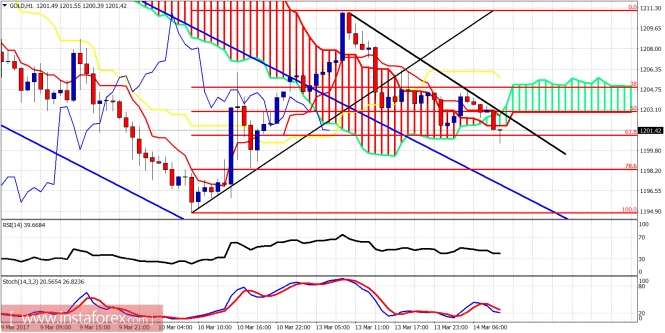
Gold price bounced yesterday towards the first important short-term resistance at $1,211 but got rejected. Price remains above $1,200 and is expected today to reverse upwards and eventually break above $1,211. Not necessarily today but I believe an important low is already in.
Blue lines – bearish channel (broken)
Black line – resistance
Gold price has stopped the decline at the 61.8% Fibonacci retracement. Price must break above resistance trend line at $1,204 in order to resume the up trend. Next short-term resistance is at $1,206. If broken the chances of a higher high above $1,211 are increased. Support is at $1,198.
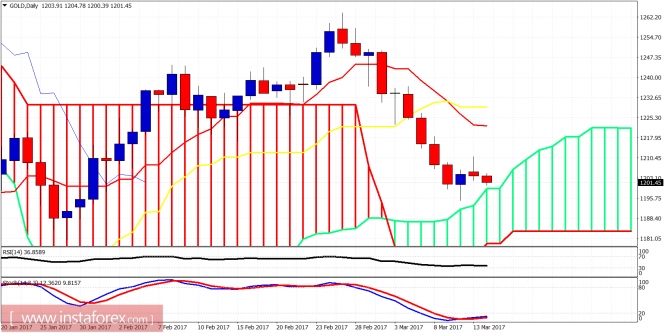
Daily Stochastic is oversold and diverging. Price is above the Ichimoku cloud support. Price should start its next upward move from current levels. Daily resistance is at $1,224 and at $1,230. Short-term trend remains bearish. My longer-term view remains bullish.The material has been provided by InstaForex Company – www.instaforex.com


