
Previous Story
Technical analysis of gold for March 17, 2017
Posted On 17 Mar 2017
Comment: 0
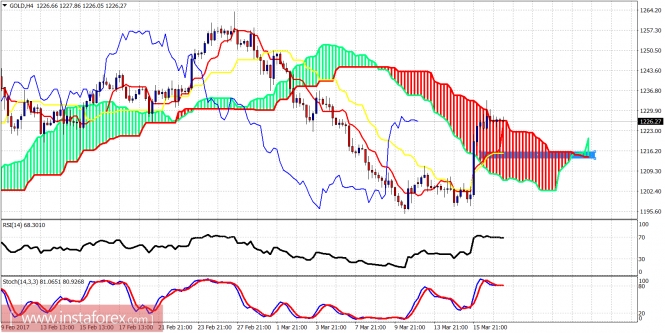
Gold price reached the top of the resistance area yesterday around $1,235 and is pulling back. This pullback is very critical and will determine if we are going to see $1,160 or the recent low is an important long-term low.
Blue rectangle – support
Gold price tried to break above the Kumo (cloud) resistance but got rejected on the 4-hour chart. This will be an important bullish sign. We need to be patient for now. I expect this support area to be tested. If prices break below it, then the bearish scenario for a push lower towards $1,180-60 will have increased chances. If support holds, then we could see another move higher towards $1,280.
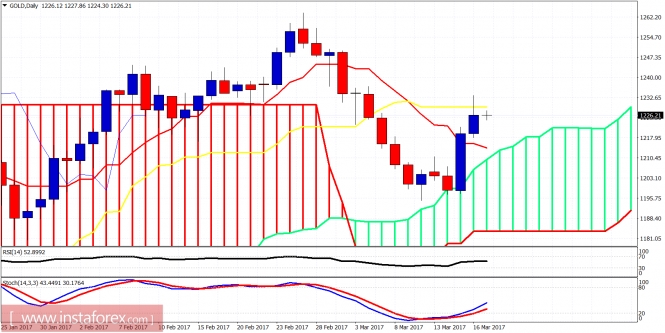
On a daily basis Gold price has stopped its rise right on the daily kijun-sen. Price could back test the tenkan-sen (red line indicator) and the cloud support at $1,215-12 area and then start its next upward move. Oscillators point higher so for now we consider the pullbacks as buying opportunities. If the $1,194 low is broken, we should expect a sharp sell off towards $1,160.The material has been provided by InstaForex Company – www.instaforex.com


