
Previous Story
Technical analysis of NZD/USD for April 20, 2018
Posted On 20 Apr 2018
Comment: 0
Overview:
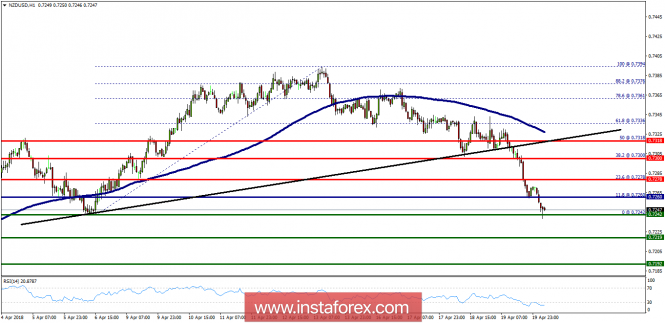
The NZD/USD pair opened below the daily pivot point (0.7260). It continued to move downwards from the level of 0.7260 to the bottom around 0.7242. Today, the first resistance level is seen at 0.7278 followed by 0.7300, while daily support 1 is seen at 0.7219. Furthermore, the moving average (100) starts signaling a downward trend; therefore, the market is indicating a bearish opportunity below 0.7260. So it will be good to sell at 0.7260 with the first target of 0.7219. It will also call for a downtrend in order to continue towards 0.7192. The strong daily support is seen at the 0.7192 level, which will represent a new double bottom on the H1 chart. According to the previous events, we expect the NZD/USD pair to trade between 0.7278 and 0.7192 in coming hours. The price area of 0.7268 remains a significant resistance zone. Thus, the trend is still bearish as long as the level of 0.7268 is not broken. On the contrary, in case a reversal takes place and the NZD/USD pair breaks through the resistance level of 0.7300, then a stop loss should be placed at 0.7318.
The material has been provided by InstaForex Company – www.instaforex.com


