Previous Story
Technical analysis of NZD/USD for December 15, 2017
Overview:
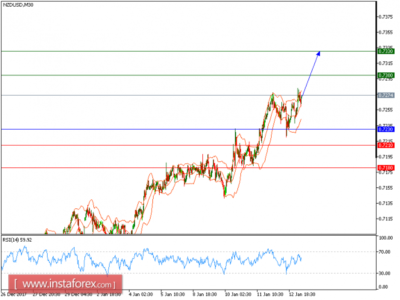
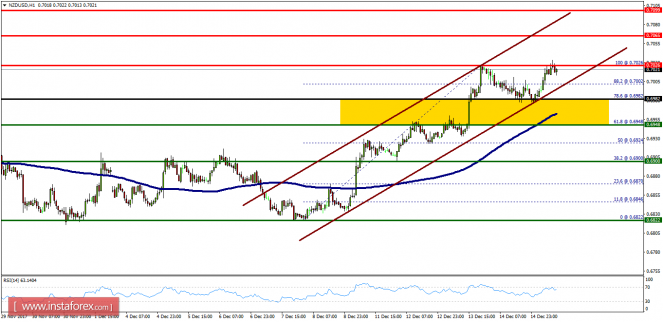
- Again, the NZD/USD pair will continue to rise from the level of 0.6948. The support is found at the level of 0.6948, which represents the 61.8% Fibonacci retracement level in the H1 time frame. The price is likely to form a double bottom. Today, the major support is seen at 0.6948, while immediate resistance is seen at 0.7026.
- Accordingly, the NZD/USD pair is showing signs of strength following a breakout of a high at 0.6948. So, buy above the level of 0.6948 with the first target at 0.7026 in order to test the daily resistance 1. Also, the level of 0.7026 is a good place to take profit because it will form a double top. Amid the previous events, the pair is still in an uptrend; for that we expect the NZDUSD pair to climb from 0.7026 to 0.7065 today.
- At the same time, in case a reversal takes place and the NZD/USD pair breaks through the support level of 0.6948, a further decline to 0.6822 can occur, which would indicate a bearish market.
The material has been provided by InstaForex Company – www.instaforex.com
Source:: Technical analysis of NZD/USD for December 15, 2017