Previous Story
Technical analysis of NZD/USD for December 19, 2017
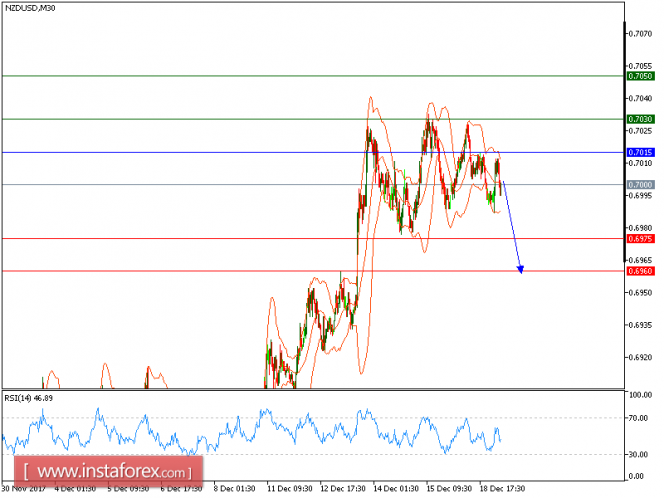
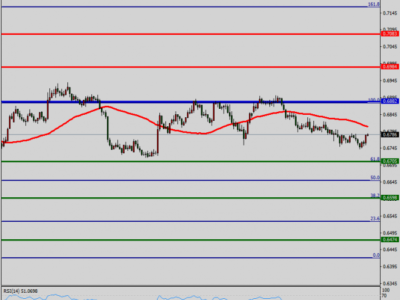
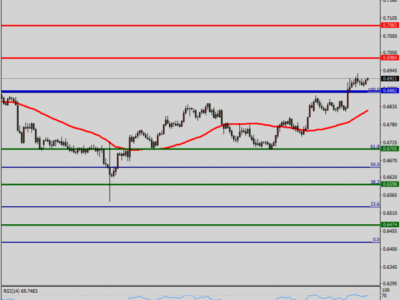
NZD/USD is under pressure below the key resistance at 0.7015, which limit the upside potential. The 20-period moving average is turning down. The relative strength index is bearish and calls for a further downside.
Therefore, as long as 0.7015 is not surpassed, look for a new test with targets at 0.6975 and 0.6960 in extension.
The black line shows the pivot point. Currently, the price is above the pivot point, which is a signal for long positions. If it remains below the pivot point, it will indicate short positions. The red lines are showing the support levels and the green line is indicating the resistance levels. These levels can be used to enter and exit trades.
Resistance levels: 0.7030, 0.7050, and 0.7070
Support levels: 0.6975, 0.6960, and 0.6920
The material has been provided by InstaForex Company – www.instaforex.com
Source:: Technical analysis of NZD/USD for December 19, 2017