
Previous Story
Technical analysis of NZD/USD for February 7, 2018
Posted On 07 Feb 2018
Comment: 0
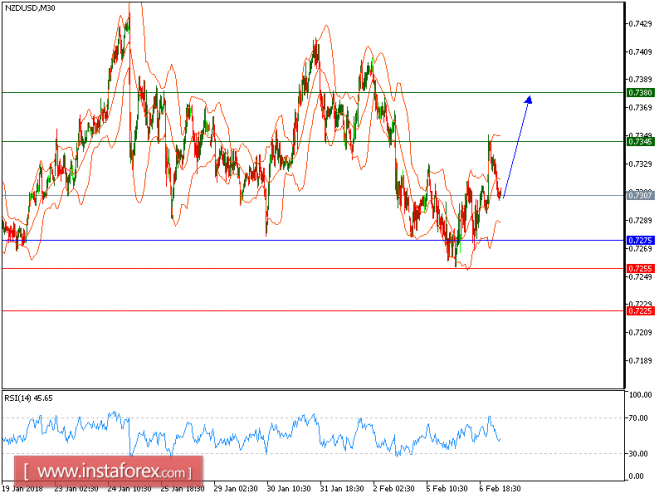
NZD/USD is expected to trade with a bullish outlook. The pair posted a inverted head & shoulder pattern, which confirmed a bullish reversal. The 20-period moving average crossed above the 50-period one. The relative strength index is supported by the ascending trend line since February 2.
Therefore, as long as 0.7275 is not broken, look for a further rise with targets at 0.7345 and 0.7380 in extension.
Therefore, below 0.7330, look for a new test with targets at 0.7265 and 0.7245 in extension.
The black line shows the pivot point. Currently, the price is above the pivot point, which is a signal for long positions. If it remains below the pivot point, it will indicate short positions. The red lines show the support levels, while the green line indicates the resistance levels. These levels can be used to enter and exit trades.
Resistance levels: 0.7345, 0.7380, and 0.7410.
Support levels: 0.7255, 0.7225, and 0.7200.
The material has been provided by InstaForex Company – www.instaforex.com


