
Previous Story
Technical analysis of NZD/USD for January 08, 2018
Posted On 08 Jan 2018
Comment: 0
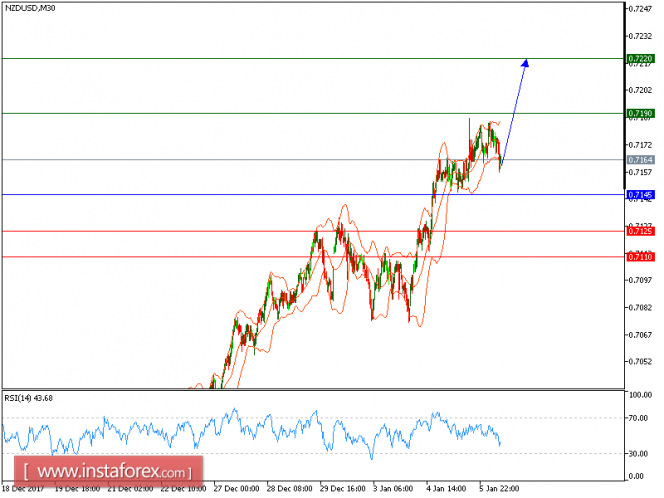
NZD/USD is expected to trade with Bullish bias. Despite the recent pullback from 0.7145 the pair still stays above its rising 50-period moving average. The relative strength index is above its neutrality level at 50. Even though a continuation of the consolidation cannot be ruled out, its extent should be limited.
Therefore, above 0.7145, look for a further advance with targets at 0.7190 and 0.7220 in extension.
The black line shows the pivot point. Currently, the price is above the pivot point, which is a signal for long positions. If it remains below the pivot point, it will indicate short positions. The red lines are showing the support levels, while the green line is indicating the resistance levels. These levels can be used to enter and exit trades.
Resistance levels: 0.7190, 0.7220, and 0.7250.
Support levels: 0.7125, 0.7110, and 0.6965.
The material has been provided by InstaForex Company – www.instaforex.com


