
Previous Story
Technical analysis of NZD/USD for April 12, 2017
Posted On 12 Apr 2017
Comment: 0
Overview:
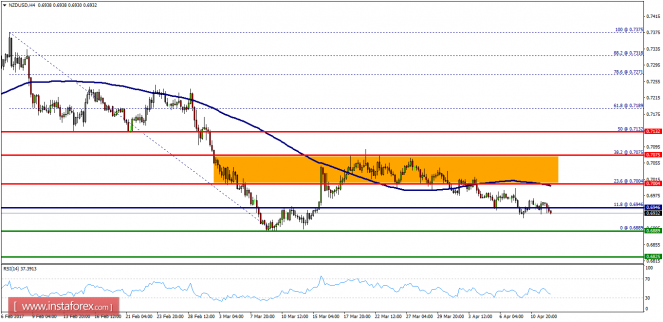
- The NZD/USD pair fell sharply from the level of 0.7075 towards 0.6946. Now, the price is set at 0.6930. On the H4 chart, the resistance of the NZD/USD pair is seen at the levels of 0.7004 and 0.7075. It should be noted that volatility is very low for that the NZD/USD pair is still moving in a narrow sideways channel (between 0.7004 and 0.6869). Moreover, the price spot of 0.7004 remains a significant resistance zone.Therefore, there is a possibility that the NZD/USD pair will move downside, and the structure of a fall does not look corrective. In order to indicate the bearish opportunity below 0.7004, sell below 0.7004 with the first target at 0.6969 in order to test last week’s bottom. Besides, it should be noted that support 1 is seen at the level of 0.6969 which coincides with the double bottom in the one-hour time frame. Additionally, if the NZD/USD pair is able to break out the bottom at 0.6969, the market will decline further to 0.6825 in order to test the weekly support 2. However, the stop loss should be placed above the level of 0.7075.
The material has been provided by InstaForex Company – www.instaforex.com


