
Previous Story
Technical analysis of NZD/USD for August 09, 2017
Posted On 09 Aug 2017
Comment: 0
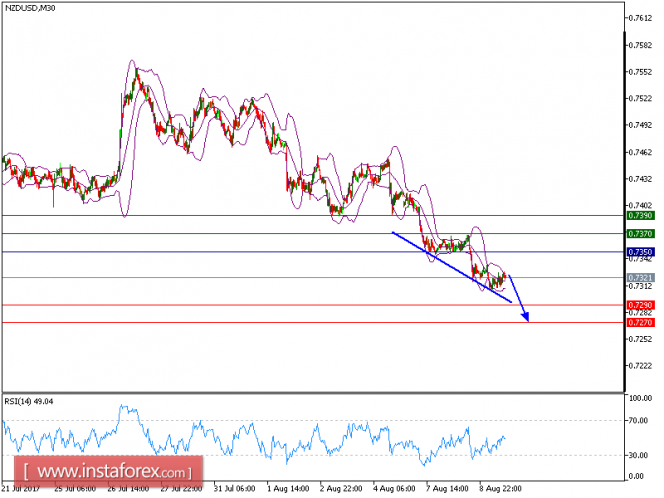
All our targets which we predicted yesterday have been hit. NZD/USD is still under pressure and expected to trade in lower range. The pair recorded lower tops and lower bottoms since August 4, which confirmed a negative outlook. The downward momentum is further reinforced by the declining 50-period moving average. The relative strength index is mixed with bearish bias.
Hence, as long as 0.7350 is not surpassed, look for a further drop to 0.7290 and even to 0.7270 in extension.
Chart Explanation:
The black line shows the pivot point. Currently, the price is above the pivot point which indicates the bullish position. If it remains below the pivot point, it will indicate the short position. The red lines show the support levels and the green line indicates the resistance levels. These levels can be used to enter and exit trades.
Resistance levels: 0.7370, 0.7390, and 0.7420
Support levels: 0.7290, 0.7270, and 0.7245
The material has been provided by InstaForex Company – www.instaforex.com


