
Previous Story
Technical analysis of NZD/USD for August 18, 2017
Posted On 18 Aug 2017
Comment: 0
Overview:
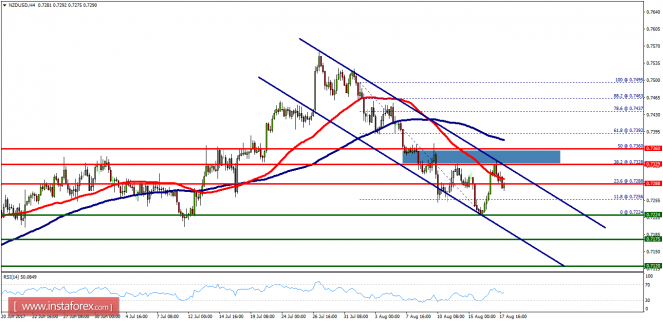
- The NZD/USD pair probably is moving towards the resistance area of 0.7329-0.7360 in order to fall again from the level of 0.7329 (the level of 0.7329 coincides with the ratio of 38.2%). Often, history will repeat itself again. However, the first resistance level is seen at 0.7288 followed by 0.7328 and 0.7360, while daily support 1 is seen at 0.7175. According to the previous events, the NZD/USD pair is still moving between the levels of 0.7288 and 0.7175; hence, we expect a range of 113 pips. If the NZD/USD pair fails to break through the resistance level of 0.7288, the market will decline further to 0.7175. This would suggest a bearish market because the RSI indicator is still in a positive area and does not show any trend-reversal signs. The pair is expected to drop lower towards at least 0.7175 with a view to testing the daily support 1. On the contrary, if a breakout takes place at the resistance level of 0.7329, then this scenario may become invalidated. Taking everything into account, we still look in the bearish market as long as the trend is below the price of 0.7360.
The material has been provided by InstaForex Company – www.instaforex.com


