
Previous Story
Technical analysis of NZD/USD for August 25, 2017
Posted On 25 Aug 2017
Comment: 0
Overview:
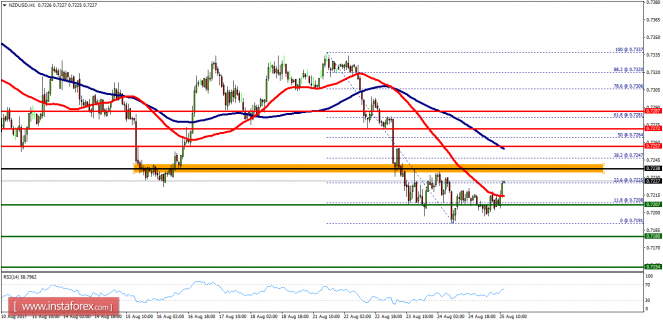
- The NZD/USD pair fell from the price of 0.7238 again towards 0.7191. Then, it rebounded from the bottom of 0.7191. Right now, the price is set at 0.7225. It should be noted that volatility is very high for that the NZD/USD pair is still moving between 0.7238 and 0.7180 in coming hours. Furthermore, the price has been set below the strong resistance at the levels of 0.7257 and 0.7272. Additionally, the price is in a bearish channel now. Amid the previous events, the pair is still in a downtrend. From this point, the NZD/USD pair is continuing in a bearish trend from the new resistance of 0.7238 which acts as a daily pivot point. The price spot of 0.7238/0.7257 remains a significant resistance zone. Therefore, a possibility that the NZD/USD pair will have downside momentum is rather convincing and the structure of a fall does not look corrective. In order to indicate a bearish opportunity below 0.7238, sell below 0.7238 or 0.7257 with the first targets at 0.7207, 0.7180 and 0.7154. On the other hand, the stop loss should be located above the level of 0.7300. Alos, it should be noticed that the price of 0.7281 coincides with the golden ratio on the H1 chart.
The material has been provided by InstaForex Company – www.instaforex.com


