
Previous Story
Technical analysis of NZD/USD for July 13, 2017
Posted On 13 Jul 2017
Comment: 0
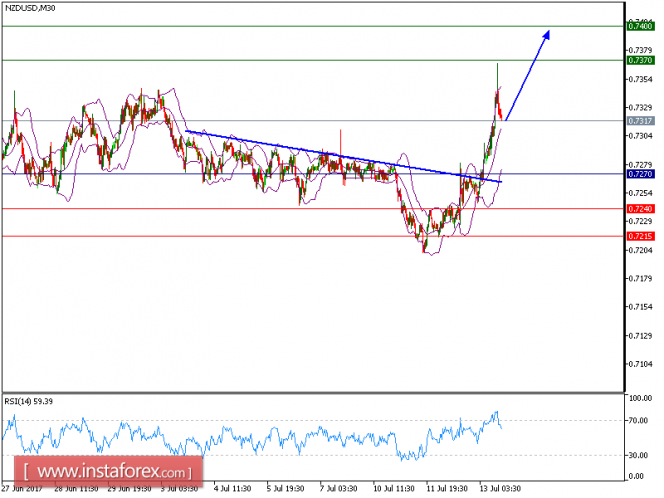
As predicted in yesterday’s analysis and in our signals, our both targets have been hit and NZD/USD crossed a previous month high of 0.7345 and posted a recent month high 0.7367. After touching this month high, the pair shed almost 40 points, but the downside should be limited. NZD/USD is still expected to continue its upside movement. Although the pair posted a pullback, it is still trading above the rising 50-period moving average, which plays a support role. The downside potential should be limited by the key support at 0.7270.
As long as this key level holds on the downside, look for a rebound to 0.7370 (today’s high) and even to 0.7400 in extension.
Strategy: BUY Stop Loss: 0.7270 Take Profit: 0.7370
Chart Explanation: The black line shows the pivot point. Currently, the price is above the pivot point which indicates the bullish position. If it is below the pivot points, it indicates the short position. The red lines show the support levels and the green line indicates the resistance levels. These levels can be used to enter and exit trades.
Resistance levels: 0.7370, 0.7400, and 0.7450
Support levels: 0.7240, 0.7215, and 0.7165
The material has been provided by InstaForex Company – www.instaforex.com


