
Previous Story
Technical analysis of NZD/USD for July 18, 2017
Posted On 18 Jul 2017
Comment: 0
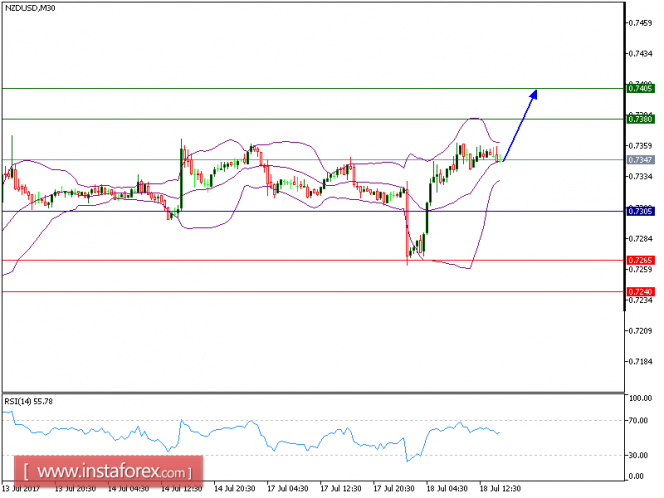
All our targets which we predicted in yesterday’s analysis have been hit. NZD/USD rebounded from 0.7265 and expected to continue its rebound. Although the pair broke below its 20-period and 50-period moving averages, it is still trading above the key support at 0.7305, which should limit the downside potential. Even though a continuation of consolidation cannot be ruled out, its extent should be limited.
Therefore, as long as 0.7305 is not broken, a rebound to 0.7380 and even to 0.7405 seems more likely to occur.
Strategy: BUY Stop Loss: 0.7305 Take Profit: 0.7380
Chart Explanation:
The black line shows the pivot point. Currently, the price is above the pivot point which indicates the bullish position. If it is below the pivot points, it indicates the short position. The red lines show the support levels and the green line indicates the resistance levels. These levels can be used to enter and exit trades.
Resistance levels: 0.7380, 0.7405, and 0.7445
Support levels: 0.7265, 0.7240, and 0.7200
The material has been provided by InstaForex Company – www.instaforex.com


