
Previous Story
Technical analysis of NZD/USD for July 4, 2017
Posted On 04 Jul 2017
Comment: 0
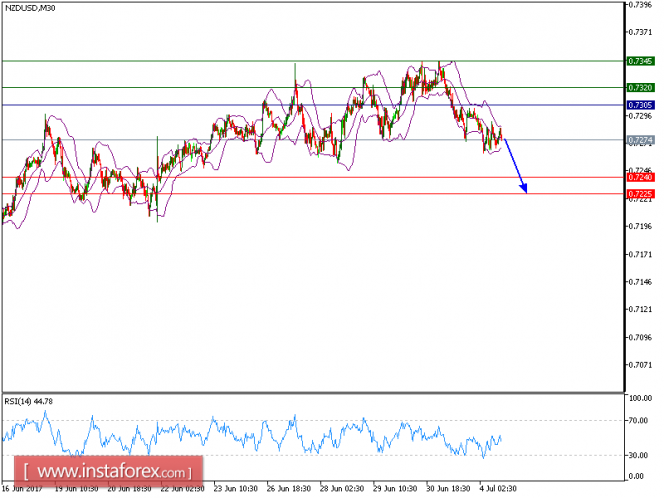
As predicted NZD/USD downside targets have been hit and NZD/USD is expected to continue its downside movement. The pair remains below its key resistance at 0.7305 and is looking for a lower bottom. The 20-period moving average stays below the 50-period moving average, and the relative strength index is around its neutrality area at 50, lacking upward momentum.
As long as the key resistance at 0.7305 is not broken above, the risk of a drop to 0.7240 remains high. Further down leg to 0.7225 is also likely.
Strategy: SELL Stop Loss: 0.7305. Take Profit: 0.7240
Chart Explanation: The black line shows the pivot point. Currently, the price is above the pivot point which indicates the bullish position. If it is below the pivot points, it indicates the short position. The red lines show the support levels and the green line indicates the resistance levels. These levels can be used to enter and exit trades.
Resistance levels: 0.7320, 0.7345, and 0.7370
Support levels: 0.7240, 0.7225, and 0.7200
The material has been provided by InstaForex Company – www.instaforex.com


